Stanford AI Index 2026: Capability Surge, Near U.S.–China Parity, Transparency Slide
HAI’s 2026 AI Index: industry >90% of notable frontier models; SWE-bench Verified ~60%→near 100% in a year; U.S.–China lead trades with Anthropic +2.7% as of March 2026; $581.7B corporate AI investment; GenAI 53% population adoption in three years — while Foundation Model Transparency Index averages fall 58→40 and incidents hit 362.

The Index’s useful tension is not “AI is big.” It is capability and capital racing ahead of transparency and public trust — SWE-bench near ceiling while dataset/compute disclosure retreats.
Stanford HAI released the 2026 AI Index Report (April 13). Headline threads: technical performance still accelerating (not plateauing); U.S.–China model-performance gap near closed; record investment; GenAI adoption faster than PC/internet; responsible-AI metrics lagging.
Selected findings (Index primary)#
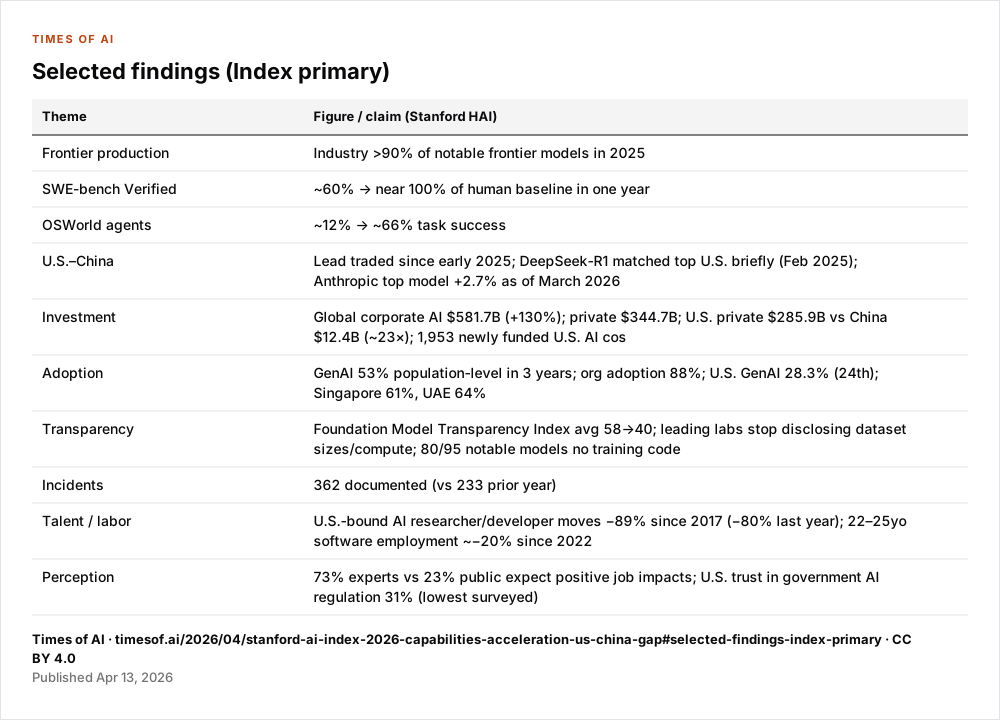
| Theme | Figure / claim (Stanford HAI) |
|---|---|
| Frontier production | Industry >90% of notable frontier models in 2025 |
| SWE-bench Verified | ~60% → near 100% of human baseline in one year |
| OSWorld agents | ~12% → ~66% task success |
| U.S.–China | Lead traded since early 2025; DeepSeek-R1 matched top U.S. briefly (Feb 2025); Anthropic top model +2.7% as of March 2026 |
| Investment | Global corporate AI $581.7B (+130%); private $344.7B; U.S. private $285.9B vs China $12.4B (~23×); 1,953 newly funded U.S. AI cos |
| Adoption | GenAI 53% population-level in 3 years; org adoption 88%; U.S. GenAI 28.3% (24th); Singapore 61%, UAE 64% |
| Transparency | Foundation Model Transparency Index avg 58→40; leading labs stop disclosing dataset sizes/compute; 80/95 notable models no training code |
| Incidents | 362 documented (vs 233 prior year) |
| Talent / labor | U.S.-bound AI researcher/developer moves −89% since 2017 (−80% last year); 22–25yo software employment ~−20% since 2022 |
| Perception | 73% experts vs 23% public expect positive job impacts; U.S. trust in government AI regulation 31% (lowest surveyed) |
Jagged frontier persists: IMO gold (Gemini Deep Think cited) vs ~50.1% analog-clock reading. U.S. hosts 5,427 data centers (>10× next); nearly all leading AI chips via TSMC Taiwan. Estimated GenAI consumer value to U.S. users $172B.
Claims vs checks#
All figures above are Stanford HAI Index / takeaways primary — aggregated research product, not a single lab bench. Benchmark definitions and “notable model” criteria are Index-methodology-dependent. Investment and adoption series depend on underlying data vendors HAI cites.
Limits#
- Index is annual synthesis; mid-year model swings can outrun the freeze date.
- Transparency and incident counts depend on reporting completeness.
- Perception surveys are not causal labor forecasts.
Sources#
- Stanford HAI: “The 2026 AI Index Report” / PDF (April 13, 2026).
- Shana Lynch: “Inside the AI Index: 12 Takeaways…” (April 13, 2026).
- Contemporaneous summaries confirming key figures.